Investing in mutual funds involves balancing potential returns against the risk of market fluctuations. While past returns can show how a fund has performed, they do not explain how much its performance has varied over time. Standard deviation helps investors understand this variation and evaluate how volatile a mutual fund’s returns have been.
For investors in India, standard deviation is a useful metric when comparing mutual fund schemes, particularly those investing in equities. However, it should not be used in isolation. Understanding what this measure reveals, how to interpret it, and where it falls short can help investors make more informed investment decisions.
What Is Standard Deviation in Mutual Funds?
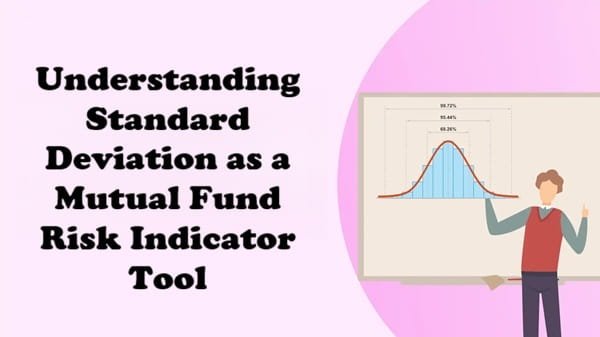
Standard deviation is a statistical measure that shows how widely a mutual fund’s periodic returns fluctuate around their average return over a specified period.
A fund with a higher standard deviation has historically experienced greater variation in returns. A fund with a lower standard deviation has generally shown less variation during the period measured.
For example, two mutual funds may have the same average return, but one may experience relatively small changes from month to month while the other moves sharply between positive and negative returns. Standard deviation helps quantify this difference. The Association of Mutual Funds in India (AMFI) identifies it as an important measure of investment volatility in mutual fund factsheets.
It is important to remember that standard deviation measures the spread of returns, not whether those returns are positive or negative.
How Standard Deviation Measures Mutual Fund Risk
Mutual fund returns change as the value of the underlying securities fluctuates. Equity funds are affected by share prices, economic conditions, corporate earnings, and investor sentiment. Debt funds may be affected by interest rates, credit quality, and liquidity conditions.
Standard deviation measures how much the fund’s returns have varied around their average during a selected period. A relatively high value suggests a more volatile historical performance, while a lower value suggests a narrower spread.
However, volatility and the possibility of permanent loss are not identical. A fund can experience substantial fluctuations without necessarily suffering the largest long-term loss, while a fund with relatively stable historical returns may still face credit, liquidity, or other risks.
Therefore, standard deviation is best understood as one indicator of risk rather than a complete measure of investment safety.
How Is Standard Deviation Calculated?
The calculation involves collecting periodic returns, finding their average, measuring how far each return differs from that average, and calculating the spread of those differences.
The basic population standard deviation formula is:
[
\sigma=\sqrt{\frac{\sum_{i=1}^{N}(R_i-\bar R)^2}{N}}
]
Here, (R_i) represents each observed return, (\bar R) is the average return, and (N) is the number of observations. When calculating standard deviation from a sample of observations, the denominator is generally (N-1) instead of (N).
In practice, mutual fund factsheets may use a defined methodology and a specified historical period. AMFI’s guidance for equity-oriented fund factsheets has described using three years of monthly return data, where available, for standard deviation and related measures. Investors should check the methodology used by the data provider when comparing figures.
Example of Standard Deviation in Mutual Funds
Consider two hypothetical mutual funds with the same average annual return of 12%.
- Fund A: Standard deviation of 5%.
- Fund B: Standard deviation of 12%.
Fund A has shown a narrower spread of historical returns, while Fund B has shown a wider spread. This suggests that Fund B’s performance has been more volatile over the period measured.
The figures do not mean that Fund A will always earn 12% or that Fund B will necessarily lose money. They also do not guarantee that future returns will remain within a particular range. Market conditions and portfolio holdings can change, and historical volatility is not a promise of future behaviour.
The example simply illustrates how standard deviation helps distinguish between funds with similar average returns but different levels of historical fluctuation.
How Investors Can Use Standard Deviation to Compare Funds
Compare funds within the same category
Standard deviation is generally more useful when comparing funds with similar investment objectives and asset allocations. For instance, comparing two large-cap equity funds may provide more meaningful information than comparing a large-cap fund with a short-duration debt fund.
Different fund categories naturally have different risk characteristics, so comparisons across unrelated categories can be misleading.
Consider returns alongside volatility
A fund with lower standard deviation is not automatically the better investment. Investors should also examine historical returns, consistency, portfolio quality, investment strategy, expense ratio, and performance against an appropriate benchmark.
A fund with higher volatility may have delivered stronger returns, but the additional risk must be evaluated in light of the investor’s financial goals and ability to tolerate losses.
Review the investment time horizon
Investors saving for a long-term goal may be able to tolerate more market fluctuations than someone who needs the money soon. However, a longer time horizon does not eliminate market risk or guarantee positive returns.
Standard deviation can help investors understand the historical volatility they may need to withstand, but it should be considered alongside liquidity needs and risk tolerance.
Limitations of Standard Deviation as a Risk Indicator
Although standard deviation is useful, it has several limitations that investors should understand.
It does not distinguish between positive and negative fluctuations. A fund that experiences unusually high positive returns can have a higher standard deviation just as a fund with sharp losses can. The measure captures variation in both directions.
It relies on historical data. A fund’s past volatility may not accurately predict its future behaviour, especially when market conditions or the investment strategy changes.
It does not measure every type of risk. Credit defaults, liquidity problems, concentration risk, and the possibility of severe market declines require additional analysis.
It can be misleading across different fund categories. A debt fund and an equity fund may have very different volatility patterns, so comparing their standard deviations alone may not provide a fair assessment.
For a more complete evaluation, investors can also examine maximum drawdown, beta, the Sharpe ratio, portfolio holdings, and the SEBI-mandated Riskometer. The Riskometer communicates a scheme’s overall risk level using six categories, ranging from low to very high.
How to Use Standard Deviation When Selecting a Mutual Fund
Start by identifying your investment objective, expected holding period, and ability to tolerate temporary losses. Next, compare the standard deviation of funds within the same category using data covering comparable periods.
Review the funds’ historical returns and risk-adjusted performance as well. The Sharpe ratio, for example, helps assess the return earned relative to the risk taken. Also examine the portfolio composition, expense ratio, fund manager’s approach, and whether the scheme fits your broader investment plan.
Do not select a fund simply because it has the lowest standard deviation. Instead, determine whether its risk characteristics are appropriate for your financial needs. If you are uncertain about interpreting these measures, consider consulting a qualified financial adviser.
Conclusion
Standard deviation is a valuable mutual fund risk indicator because it measures how widely a scheme’s returns have fluctuated around their average. A higher value generally indicates greater historical volatility, while a lower value suggests less variation over the period examined.
However, it does not predict future returns or capture every possible investment risk. Investors should use it alongside returns, risk-adjusted performance, portfolio analysis, and the Riskometer when evaluating mutual funds. A balanced assessment can help investors choose investments that better match their goals and risk tolerance.
Frequently Asked Questions
Q. What does standard deviation mean in mutual funds?
Standard deviation measures the spread of a mutual fund’s returns around its average return over a specified period. It helps investors understand the fund’s historical volatility.
Q. Is a lower standard deviation always better?
No. Lower standard deviation indicates less historical fluctuation, but it does not automatically mean better performance or lower overall risk. Investment objectives and other risk factors also matter.
Q. Does a high standard deviation mean a mutual fund will lose money?
No. It indicates greater variation in historical returns, including both positive and negative movements. It does not predict whether future returns will be positive or negative.
Q. How can I find a mutual fund’s standard deviation?
You can check the scheme’s factsheet or a reliable mutual fund research platform. Compare figures calculated over similar periods and using consistent methodologies.
Q. Is standard deviation useful for debt mutual funds?
Yes. It can help assess historical return volatility in debt funds, but investors should also examine credit risk, interest-rate sensitivity, liquidity, and portfolio quality.
Q. What is the difference between standard deviation and beta?
Standard deviation measures the overall variability of a fund’s returns. Beta measures how sensitively a fund’s returns have historically moved relative to a benchmark. Both provide different perspectives on risk.